Adding a component drilldown
How to edit an existing component and add a drilldown into the data
The Intuitive for Papercut solution is provided with a suite of pre configured components. In some cases you might with to add a level of drilldown. General help on drilldowns is available in the product documentation, so here we will look at a worked example from the solution.
Ensure that you are logged into the system with Dashboard Designer privileges. Open the Cost dashboard and locate the component shown below.
Click onto the cog wheel menu and select edit component to open the component editor.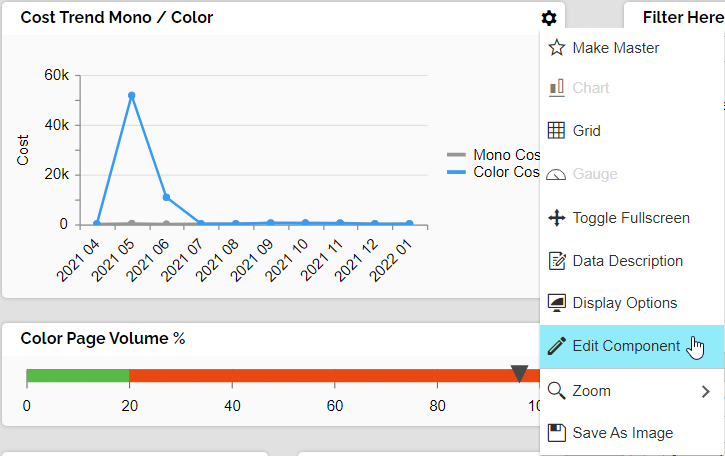
We can see that this component does not currently have a drilldown as it is only displaying one level. ![]()
For components of more than one level you can still add further drilldowns by navigating to the lowest level.
To add a new component drilldown, click on the icon as shown.
You will now see the following information message in the header bar
Click onto one of the months on the graph to open the new drilldown.


Underneath the component title you can see a breadcrumb representing where you clicked on the previous level on the component. In this case May 2021.

When you build the drilldown, all results will initially be filtered to show only May 2021.
The next step is to select the type of drilldown you would like to create. The options are:-
- Chart
- Grid
- Gauge
- HTML
- Drillout (to connect to an external system, see user documentation)
For our example we will use a chart. This is the default setting if nothing is selected.
We must now select an Attribute and one or more measures to add to the chart. The attributes and measures can be found in the dataset on the left hand side of the screen.
We will use the attribute Grayscale for our example.
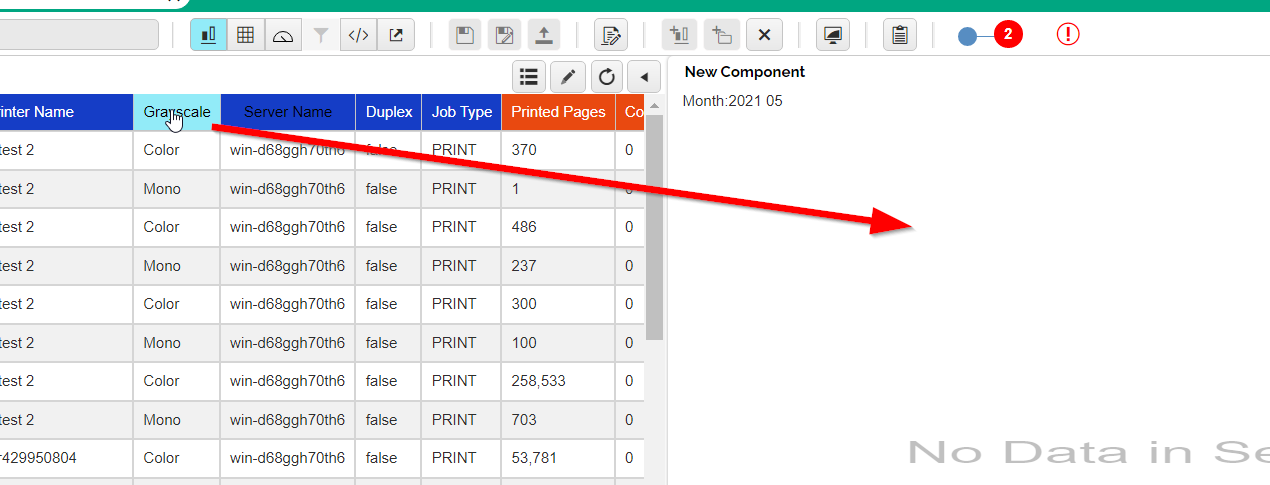
To quickly find the measures, we can change the dataset into list view by clicking this button.
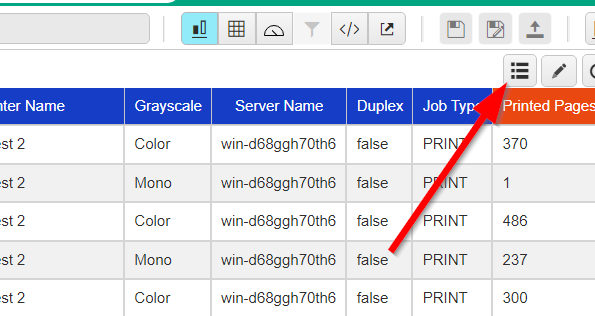
This will display a list of attributes and measures along with a search bar for easy access. Try searching for pages in the list of measures. It should look as follows: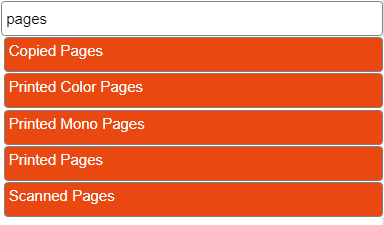
Find the measure called ‘Printed Pages’ and drag onto the empty component on the right hand side of the screen.
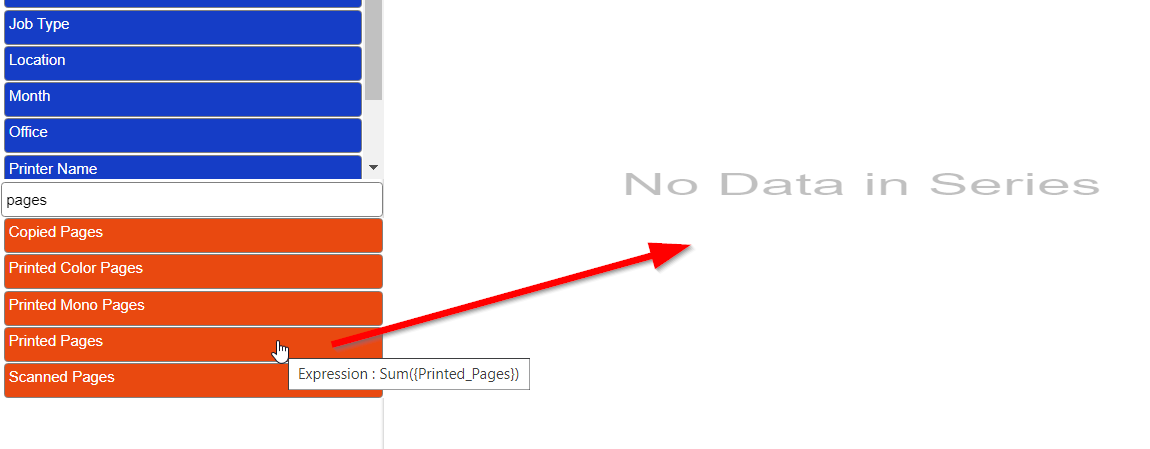
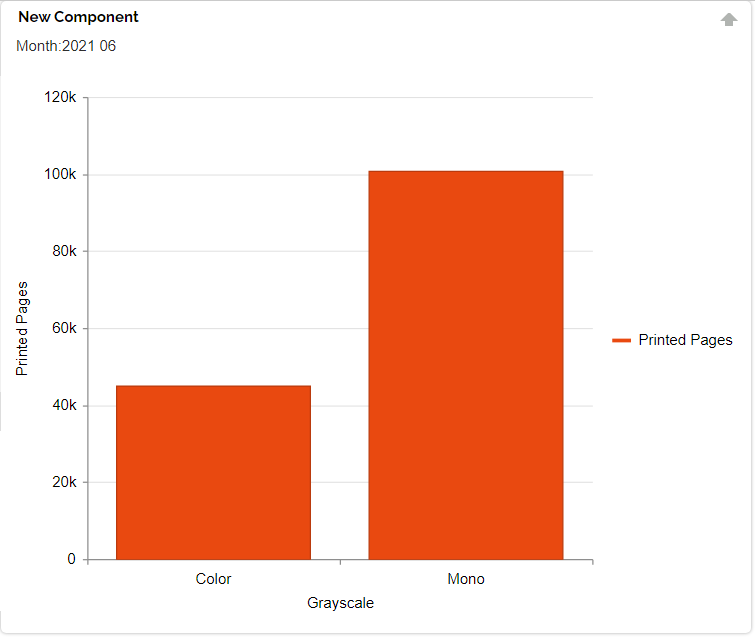
You should now have a component which looks something like the one below.
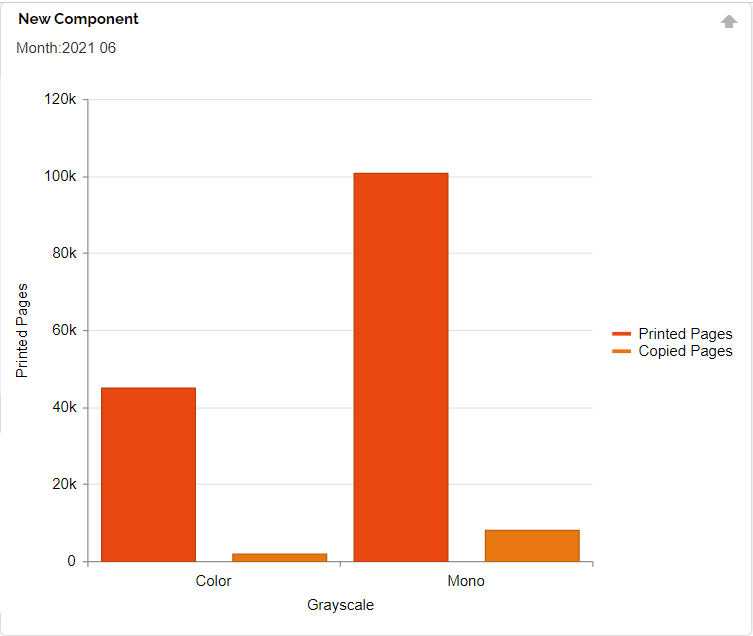
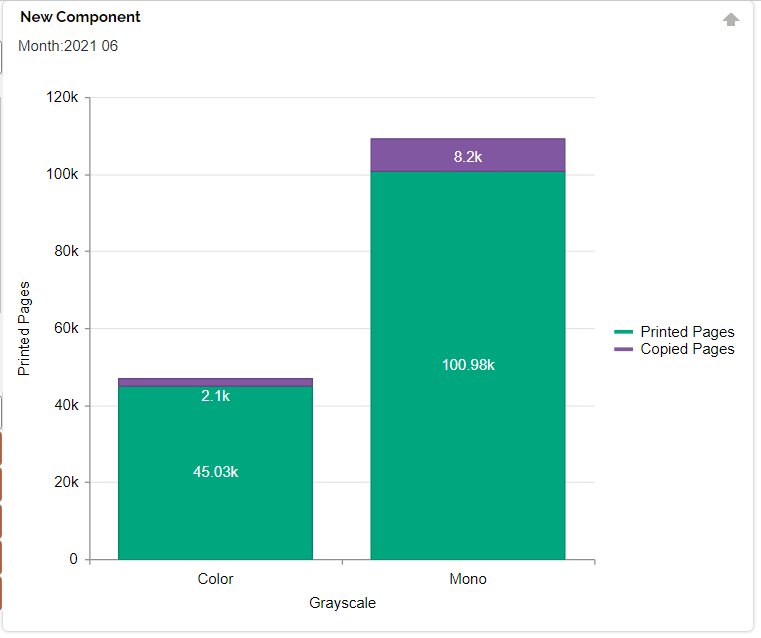
Add a second measure, ‘Copied Pages’ to the component, the result will look as follows:
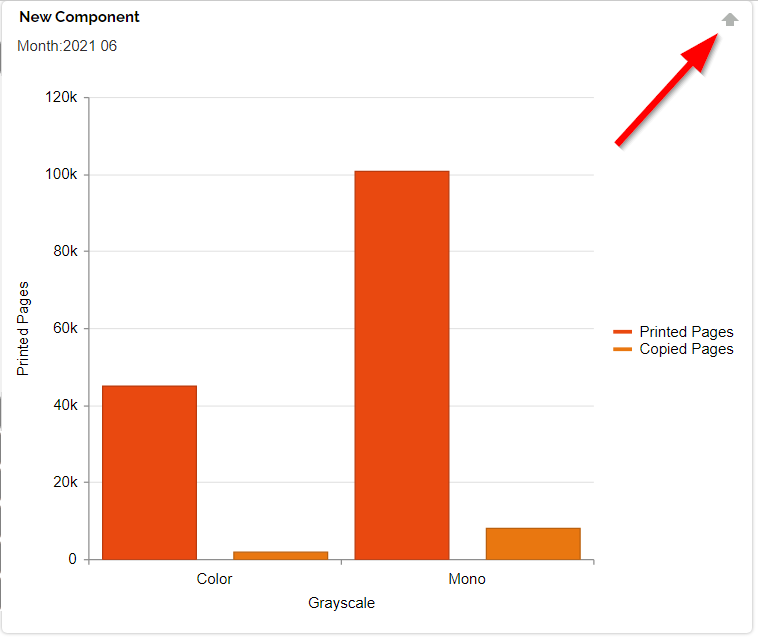
You can test your new drilldown by clicking on the arrow in the top right hand corner of the component to navigate to the top level of the component. Select a different month to check that the drilldown works.
Finally you can add a component title to the drilldown and use the display options to optimise the display. For a full list of display options see the product manual. The result below shows a stacked chart with labels. The colours of the data series have also been changed
Next Article - Creating a new menu component