- Help Center
- Intuitive for PaperCut MF V3
- Editing PaperCut Dashboards
-
Intuitive Dashboards Core Software
- Getting Started
- Viewing Dashboards
- Interacting with dashboards
- Filters
- Connections
- Datafeeds
- Datasets
- Components
- Creating Dashboards and Components - Overview
- Creating Components
- Creating a Dashboard
- Administering the System
- Administering Users
- Administering Groups
- Security Filters - V5.2 and earlier
- Security Filters - V5.3 Onward
- Embedding Dashboards
- Configuration File
- Installation & Configuration Guide
- Version History
-
Intuitive for PaperCut V2
-
Intuitive for PaperCut MF V3
-
Intuitive for SAFEQ
-
Intuitive For Managed Print Services (MPS)
-
Intuitive Cloud Services
-
Intuitive for PaperCut Hive V1
-
Intuitive for SAFEQ Cloud
-
Intuitive for Docuware
-
FAQ
Adding labels to a data series
Add values onto your graph components
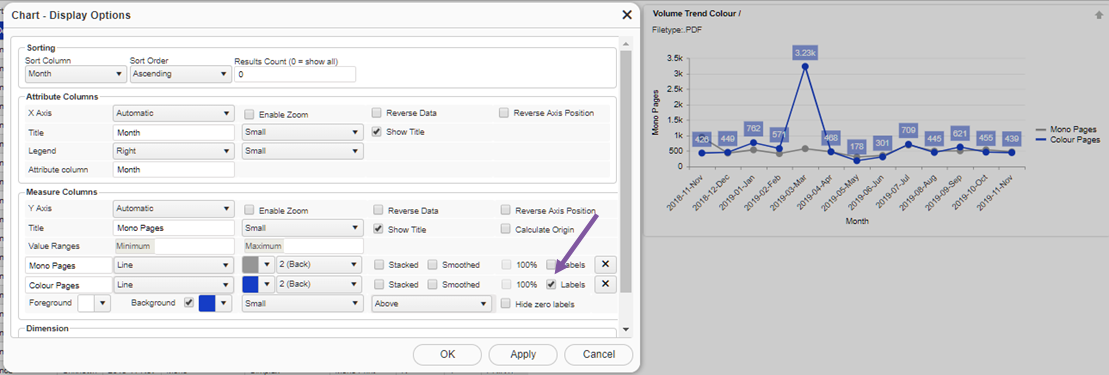
Open the level of the component you wish to edit and select the ‘display options’ icon (Refer to Component Builder Layout). In order to add labels to a data series, select the check box as shown. The label options will appear below. Select the appropriate options to give the best visual appearance on the component. Click apply to preview results and OK when finished. Don’t forget to save the results
Next Article - Changing the colour of a graph