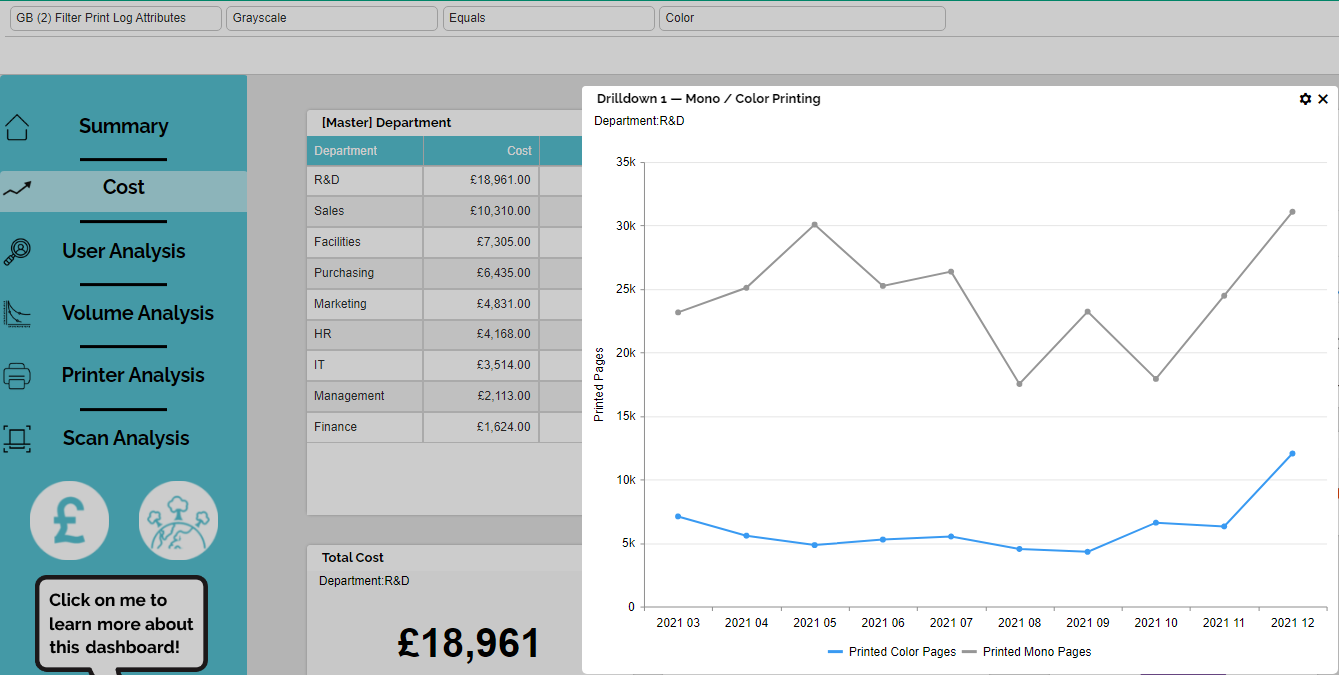
By selecting the right combinations you can get right to the precise question you wish to ask of the data. In the example shown below, we have:
1. Selected a filter to show colour only;
2. Selected the R&D department from the Master;
3. Drilled down to show the printed volume trend
The result is that we can see the trend for colour documents in the R&D department.