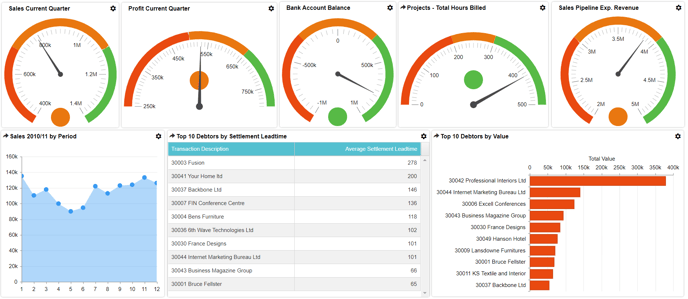
A dashboard is a collection of components that are all displayed together on one screen. A component can be a chart, gauge or grid. The dashboard below displays:
- A horizontal bar chart
- An area chart
- A radial full full-circle gauge
- A radial semicircle north-facing gauge
- A data grid
- Drilling down
- Applying filters
- Interacting with charts
- Interacting with gauges
- Interacting with grids
- Refreshing data
Additionally, as a Dashboard Viewer you can temporarily change the dashboard colour scheme. The colour scheme will not be saved after the dashboard has been closed. If you want to make permanent changes to the dashboard, please contact the Dashboard Designer or Dashboard Administrator.