Dashboards allow the viewer to deeply explore the information within the individual components through a technique called drilldown.
Component drilldowns are defined at build-time when creating/editing a component. A component is a self-contained 'control' and all the levels of drilldown defined at build-time are contained within the single component.
When a component drilldown is available, a pointing finger appears when hovering over the top-level component. An arrow symbol is also shown in the title (both circled in red in the graphic below).

When the user clicks on the top-level component a drilldown pop-up window will be displayed showing the component drilldown. You can create as many levels of drilldowns as you require in the same component. The number of drilldown levels defined normally depends on the granularity of the data in the dataset and the business need.
When the user clicks on the top-level component a drilldown pop-up window will be displayed showing the component drilldown. You can create as many levels of drilldowns as you require in the same component. The number of drilldown levels defined normally depends on the granularity of the data in the dataset and the business need.
In the example below, the 'Expected Revenue By Deal Stage' chart has a drilldown to the 'Expected Revenue by owner' pie chart which is filtered automatically for 'Stage 1 - Lead'.
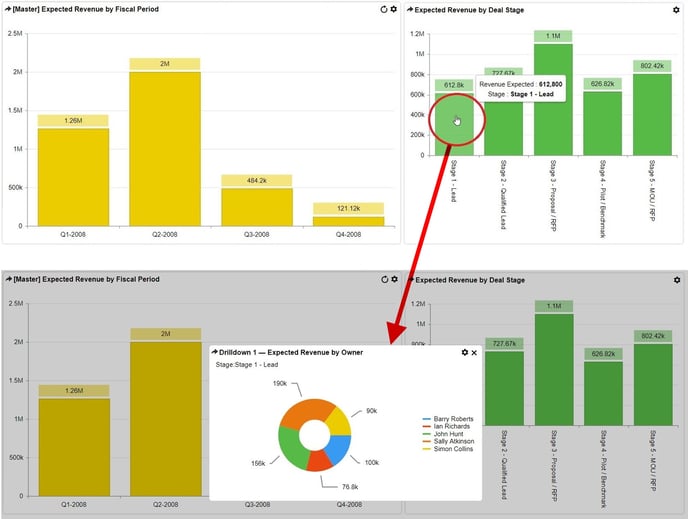
Drilldown components are always based on the same dataset as the top-level component. If the top-level component is a chart or grid then the attribute value 'clicked-on' to fire the drilldown will be used to automatically filter the drilldown component. A 'breadcrumb' trail will show the filters applied at each level of drilldown.
Drilldown components are always based on the same dataset as the top-level component. If the top-level component is a chart or grid then the attribute value 'clicked-on' to fire the drilldown will be used to automatically filter the drilldown component. A 'breadcrumb' trail will show the filters applied at each level of drilldown.
In addition to Component Drilldowns it is also possible to create Dashboard Drilldowns, where one component can ultimately drilldown to another dashboard passing parameters to pre-filter the dashboard.