- Help Center
- Intuitive for PaperCut MF V3
- Editing PaperCut Dashboards
-
Intuitive Dashboards Core Software
- Getting Started
- Viewing Dashboards
- Interacting with dashboards
- Filters
- Connections
- Datafeeds
- Datasets
- Components
- Creating Dashboards and Components - Overview
- Creating Components
- Creating a Dashboard
- Administering the System
- Administering Users
- Administering Groups
- Security Filters - V5.2 and earlier
- Security Filters - V5.3 Onward
- Embedding Dashboards
- Configuration File
- Installation & Configuration Guide
- Version History
-
Intuitive for PaperCut V2
-
Intuitive for PaperCut MF V3
-
Intuitive for SAFEQ
-
Intuitive For Managed Print Services (MPS)
-
Intuitive Cloud Services
-
Intuitive for PaperCut Hive V1
-
Intuitive for SAFEQ Cloud
-
Intuitive for Docuware
-
FAQ
Add ranges to grids
Adding ranges allows you to highlight the data and set targets
Open a component or drilldown that has a grid format. Ranges can be used to highlight values that are of interest e.g. when a value exceeds a target.
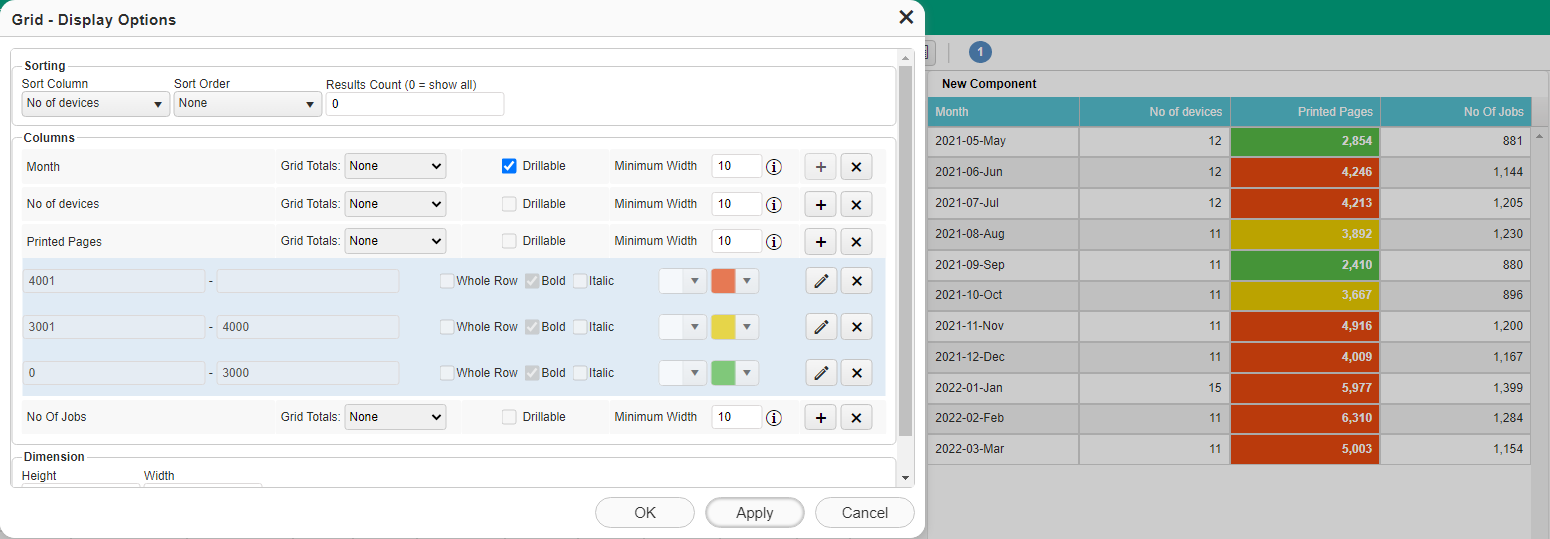
To add a new range click on the + symbol next to the appropriate measure or attribute
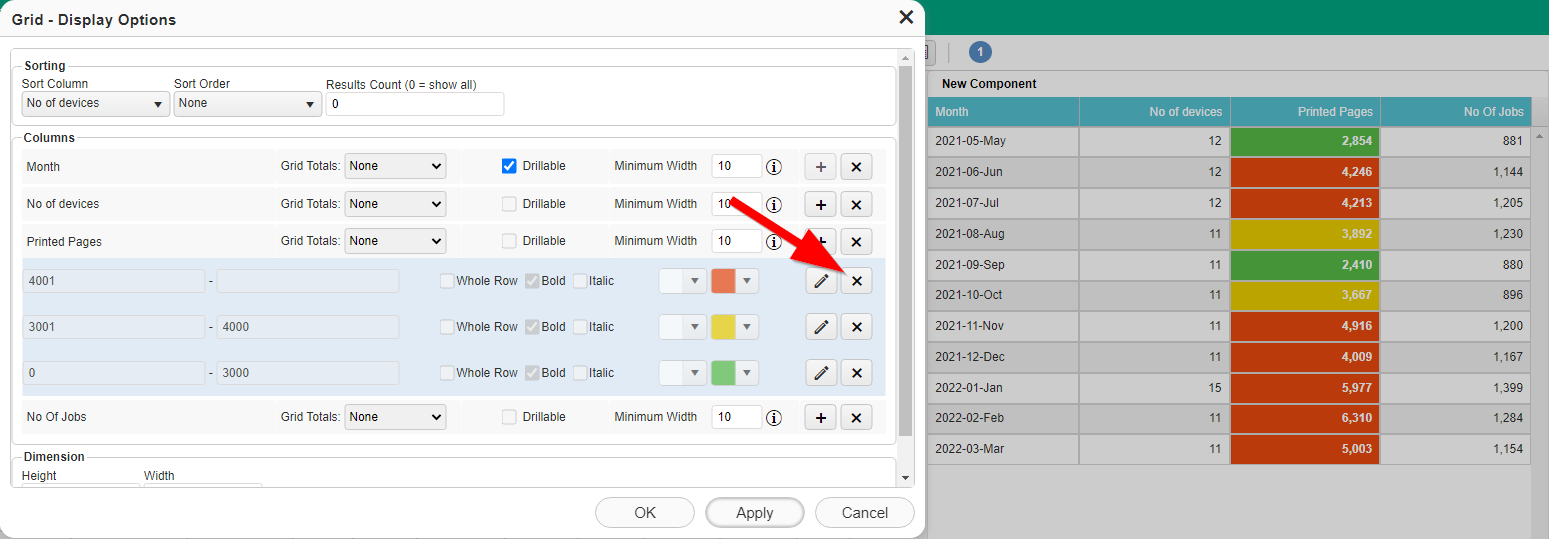
For measures, each range is given an upper and a lower numeric value. When the result of the measure is between these values the cell or row will be highlighted according to the colour configuration
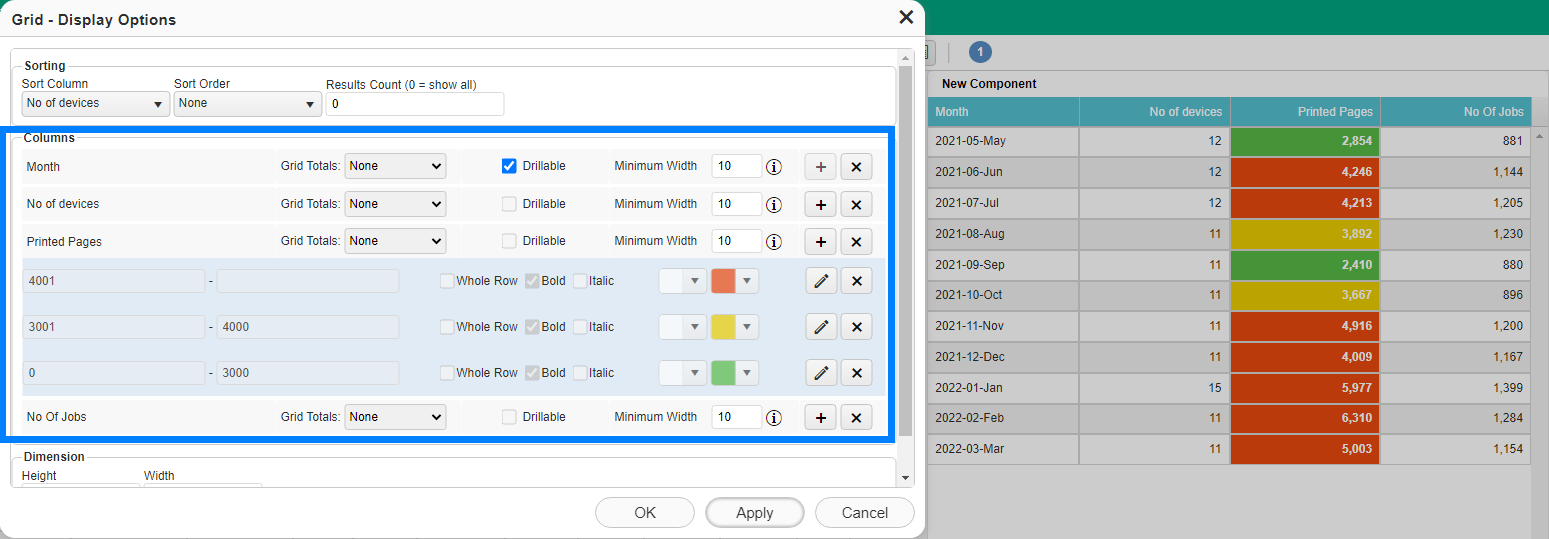
For attributes, you can configure the component to match a particular string value. The operators available are Equals, Not Equals, Contains, Starts with & Ends with.
Next Article - Add a component drilldown