Using Master filters is a quick way of filtering a dashboard using a single parameter. If you would like to:
1. Apply a more complex filter
2. Apply multiple filters at the same time
We recommend that you make use of the filters panel. The filters panel can be opened using the filter icon located near to the menu on the right hand side of the screen ![]()
On opening the filter panel, you will be shown any filters that are already applied. To add a filter click on the symbol as shown 
Having chosen to add a filter your display should now look like this:

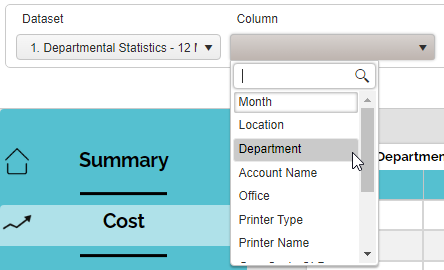
Select a dataset from the dropdown menu to reveal a list of available dataset columns which can be filtered. A list of datasets and available columns is included in this guide. Common parameters such as department will filter all components on the dashboard.
Once you have selected a parameter to filter, you can apply an operation. Operations will differ depending on the attribute selected.
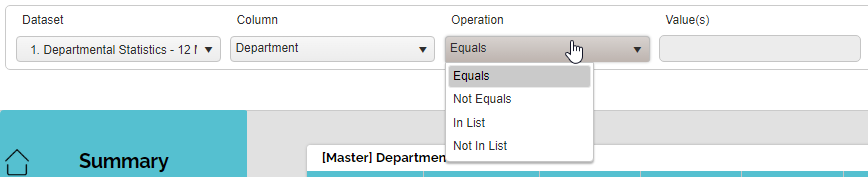

Finally select (or enter) the values you wish to filter the dashboard by and click on the tick icon to implement.
To maximise viewing space on the dashboard you can click on the filter icon again to close the filters panel. You can open the filters panel at any time to edit or add filters. All filters are added for this session only.
Filtering examples
Show me copies printed in colour

Show me double sided documents printed in the Sheffield office
