When viewing a chart, you can display the underlying data as a grid, if required.
To view an underlying data grid:
1 Click the Options button on the chart.
2 Select Grid from the drop down menu.
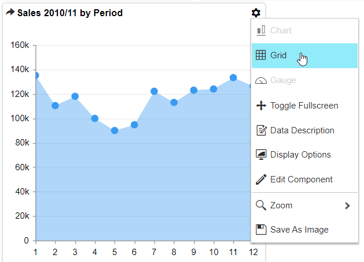
The underlying data for the chart is displayed.
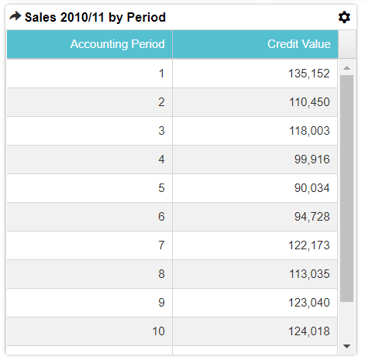
3 Interact with the grid, as required.
1 Click the Options button on the chart.
2 Select Grid from the drop down menu.
The underlying data for the chart is displayed.
3 Interact with the grid, as required.
4 Data shown in the grid can also be exported to a spreadsheet from here using the component menu.
5 Select Options > Chart from the component menu, to switch back to chart view.
5 Select Options > Chart from the component menu, to switch back to chart view.