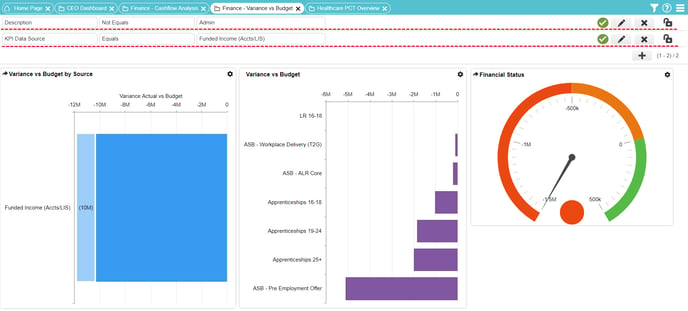
Filtering a dashboard
It is sometime desirable to limit the information shown on a dashboard and this is achieved by adding filters to the dashboard. Permanent filters can be added to the dashboard at design-time or temporary filters can be applied when viewing a dashboard.
Dashboards are filtered by clicking on a Master component in a Master Detail Dashboard or by applying filters ![]() to the underlying datasets used by the individual components on a dashboard
to the underlying datasets used by the individual components on a dashboard
Note: From V6.0 onwards, dashboards can also be filtered via Filter Components that can be placed directly onto the dashboard surface.
Where there are many different datasets represented on a dashboard an individual filter would normally have to be applied to each dataset individually to filter a dashboard appropriately, unless linked dataset filters have been defined.
Linked dataset filters: Where the 'same column' appears in multiple datasets (for example, the 'Customer Account Number' might appear in every dataset), to save time having to apply the same filter over-and-over for each dataset, the same columns in each dataset can be 'linked' together at dataset level.
Therefore, a filter applied to one dataset will automatically be applied to other datasets where a link has been created.
Note: If you are only viewing a dashboard, any filters created will only be temporary and exist only for the life of the dashboard viewing session. These filters can be toggled on and off during the session. Once the dashboard is closed, the filters will be lost (reset back to the default).

To filter a dashboard
1. Click the filter drop down icon: ![]()
2. Select the add filter icon: ![]()
3. For dashboards with components from multiple datasets, you will need to select the relevant dataset first. If you hover over the dataset name, an info panel will appear to inform you of which components will be affected.
For dashboards with components from only one dataset, you will skip step 3
Note: Where different datasets contain the same column i.e. Region, a linked filter can be created at dataset level to allow the same filter to be automatically applied to all datasets at the same time.
4. Next, you can create the filter using the following sections:
Column:
This permanently sets the dataset column that this filter will be based on.
Operation:
For string values the operations are Equals/Not Equals and In List/Not In List.
For Numerical values they are Equals/Not Equals, Between/Not Between and Greater Than/Less Than.
Value(s):
Depending on the Operation selected determines what values can be selected for the filter.
5. Once the filter is complete, you can select the save button (green tick) and the dashboard will automatically refresh with the filter applied
6. This process can be repeated as many times as required.
7. Filters can be toggled on and off using the 'green tick' and the 'red sign' icons.
![]()
![]()
8. Any unlocked filters can be edited using the 'Pencil' icon: ![]()
9. Any unlocked filters can be deleted using the 'red filter delete' icon: ![]()
10. Any associated dataset linked filters will be identified by the 'Linked columns' icon ![]()
See also: From V6.0 onwards, dashboards can also be filtered via Filter Components.