Intuitive provide the following dashboard component types:
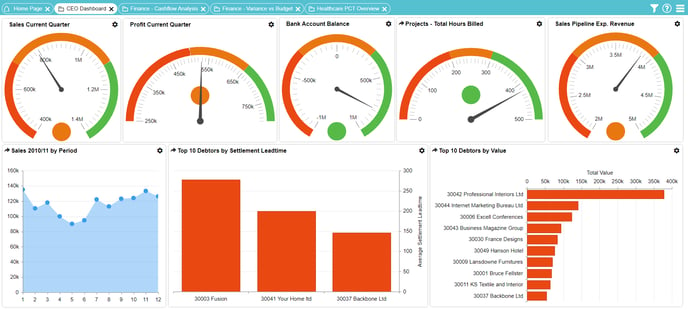
A chart is graphical representation of data which can be displayed in a variety of chart type formats. The dashboard below displays the following charts:
- A horizontal bar chart (Bottom Middle)
- An area chart (Bottom Left)
- A vertical bar chart (Bottom Right)
Once you have logged in and selected a dashboard, you can interact with charts by:
Additionally, as a Dashboard Viewer you can make the following temporary changes to charts:
- Defining chart display options
- Defining chart axis, sort and label options
- Defining chart background colour
These changes will not be saved after the dashboard has been closed. If you want to make permanent changes to the dashboard, please contact the Dashboard Designer or Dashboard Administrator.